Two Powers, One Model: Independent Ti-6Al-4V Validation
Baal Hammon Thermomechanics is tested against measured thermal histories and melt-pool dimensions at 400 W and 600 W—without fitting the displayed validation curves.
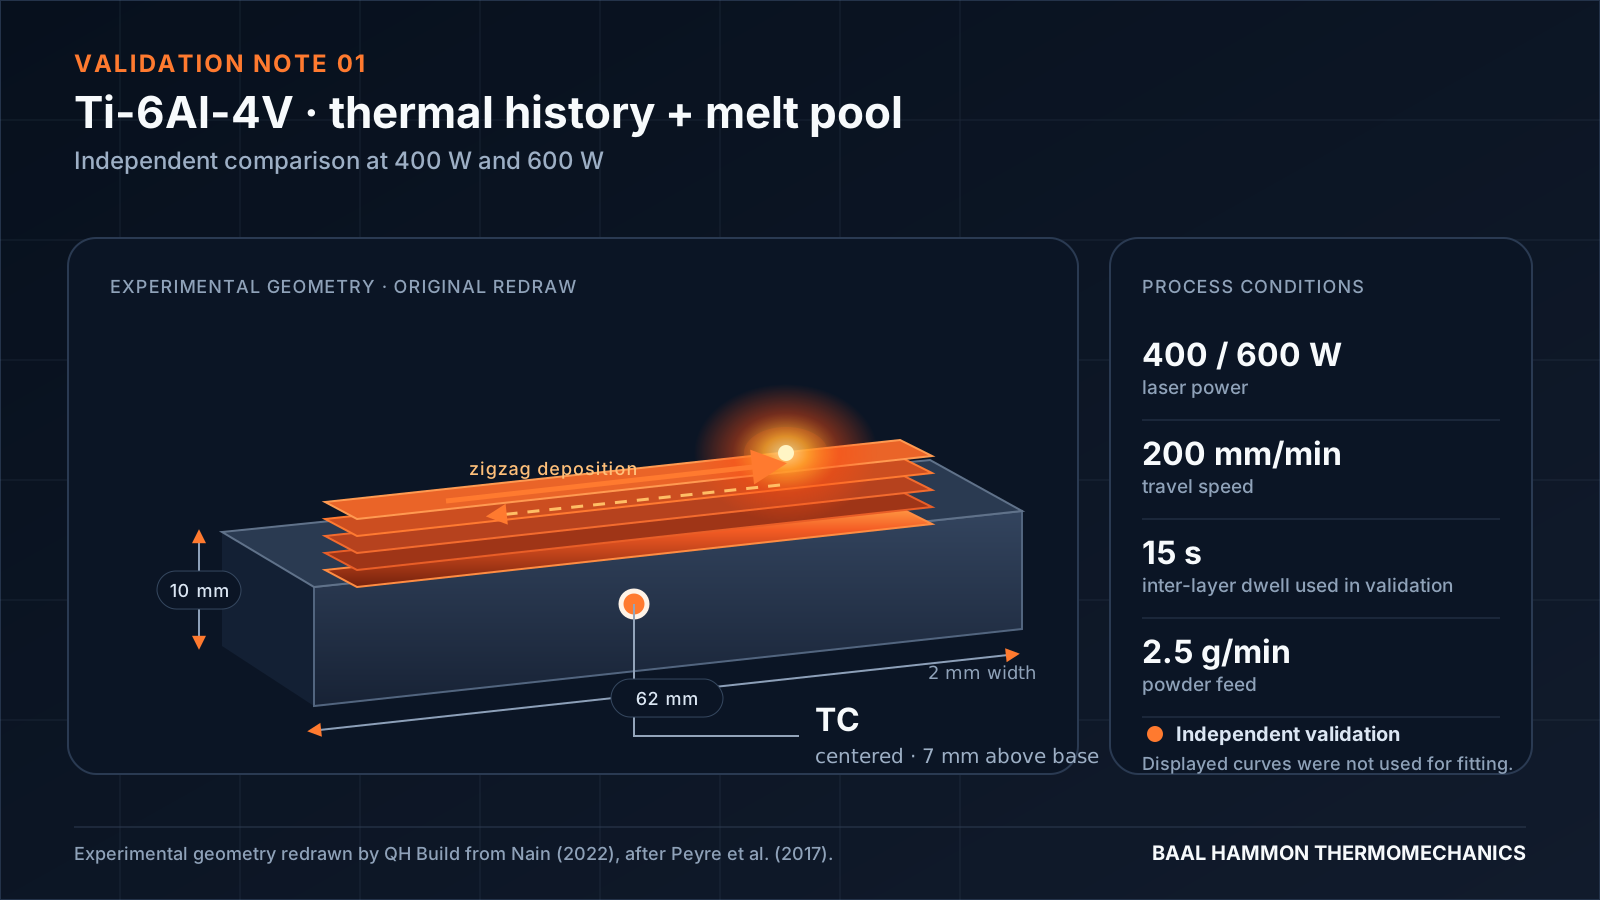
A temperature contour is not validation. A solver earns confidence when its predictions are compared with measurements it did not see during calibration—and when the comparison tests more than one operating condition.
In this case, Baal Hammon Thermomechanics was evaluated against Ti-6Al-4V directed-energy-deposition experiments at 400 W and 600 W. The comparison covers both the temperature evolution inside the substrate and the dimensions of the resulting melt pool.
The strongest result is not a single close point. It is the consistency of the response across repeated heating and cooling cycles, two power levels and two different validation quantities.
The validation case
The experiment deposits a zigzag Ti-6Al-4V wall on a matching Ti-6Al-4V substrate. The substrate is 62 mm long, 10 mm high and 2 mm wide. The thermocouple is centered in the substrate, 3 mm below its upper surface—or 7 mm above the base.
Both power cases use a travel speed of 200 mm/min, a powder feed rate of 2.5 g/min and a 15 s inter-layer dwell in the validation configuration. The same thermocouple location is used at 400 W and 600 W.
Simulation in motion
The sequence below shows the moving heat source and the evolving temperature field predicted by Baal Hammon during deposition.
Baal Hammon Ti-6Al-4V deposition simulation showing the moving heat source and evolving temperature field
Thermal history at 400 W
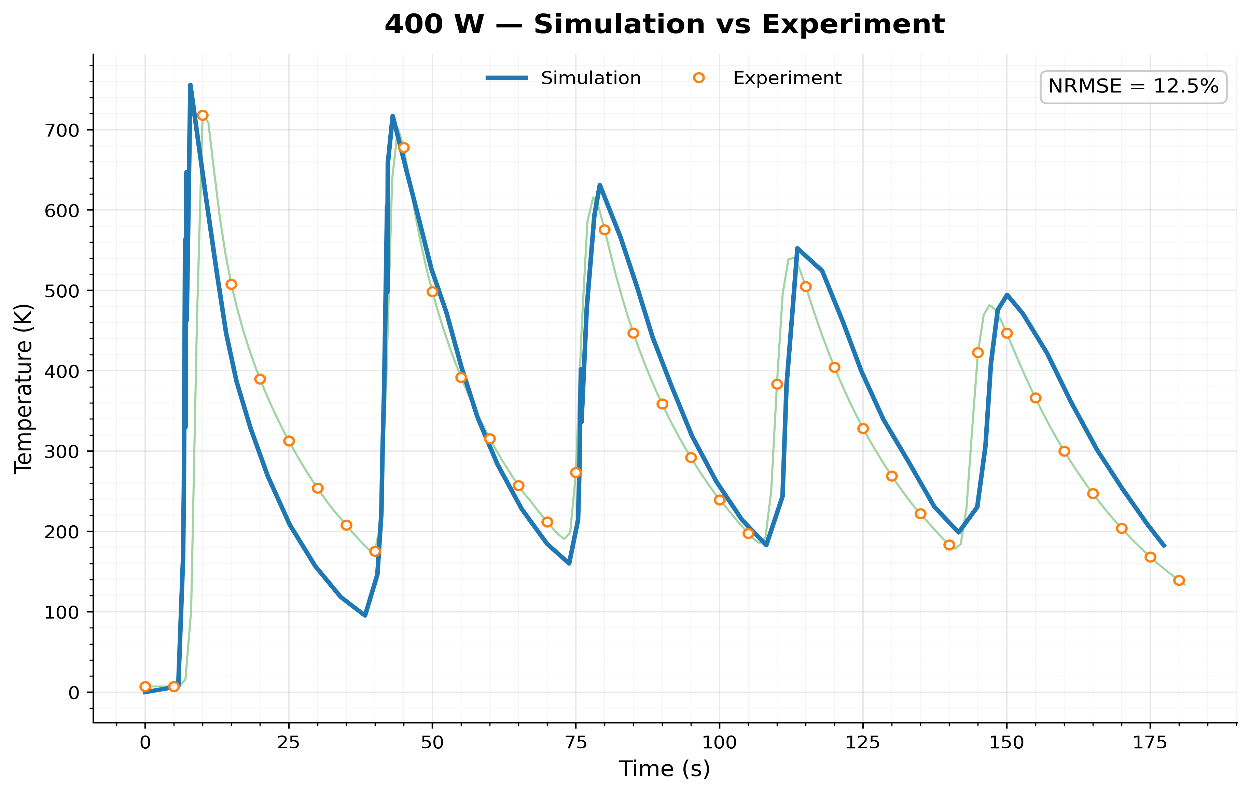 At 400 W, Baal Hammon predicts the measured sequence of heating peaks and cooling intervals with a 12.5 percent NRMSE
The simulated history reproduces the repeated temperature peaks as the heat source returns near the thermocouple, together with the progressive thermal accumulation in the substrate. The reported NRMSE is 12.5%.
Thermal history at 600 W
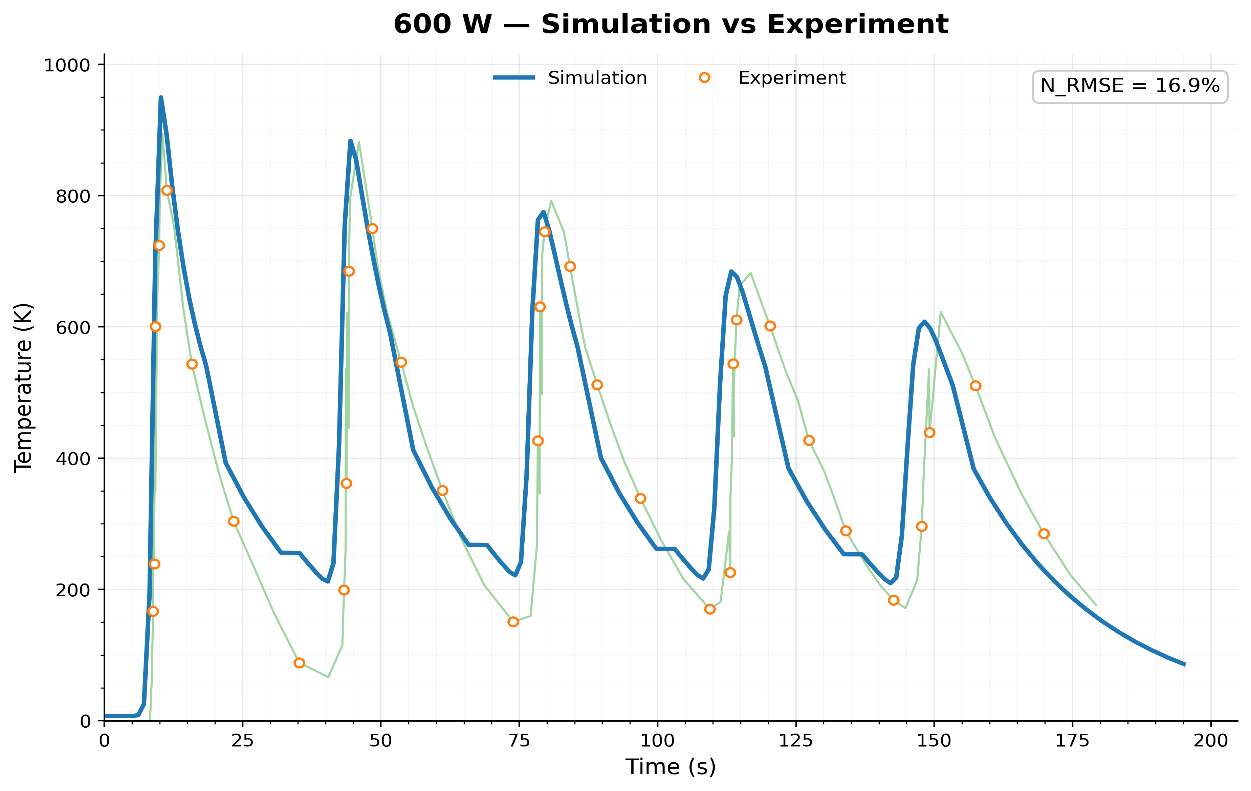 At 600 W, Baal Hammon predicts the measured thermal history with a 16.9 percent NRMSE
At 600 W, the model captures the higher peak temperatures and the overall decay between passes. The reported NRMSE is 16.9%.
In both charts, the blue curve is the Baal Hammon prediction. The orange markers are experimental measurements. The thin green line only connects the experimental points visually; it is not a third dataset.
The experimental series was not shifted, smoothed, interpolated or resampled. NRMSE is calculated over the aligned experimental and simulated samples as:
NRMSE = RMSE / peak-to-peak experimental temperature × 100
where the normalization span is max(T_exp) − min(T_exp).
A second test: melt-pool geometry
Thermal-history agreement tests the accumulated response of the part. Melt-pool dimensions test the model much closer to the moving energy source.
The simulated melt pool is extracted using the material liquidus temperature as the boundary.
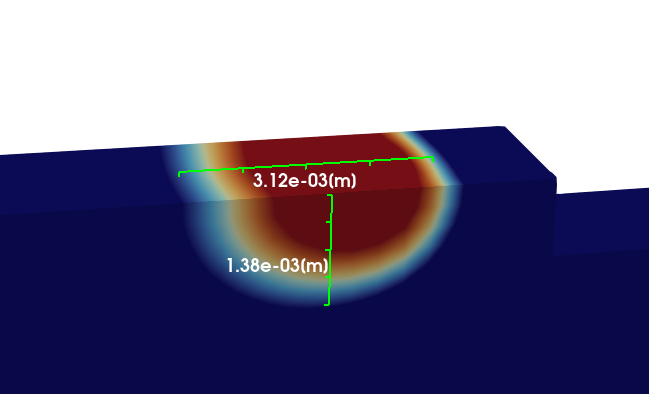 Simulated Ti-6Al-4V melt pool at 400 W, with a predicted length of 3.12 mm and height of 1.38 mm
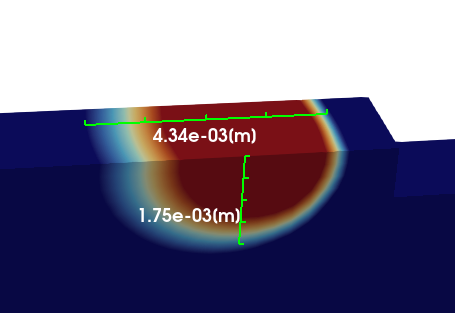 Simulated Ti-6Al-4V melt pool at 600 W, with a predicted length of 4.34 mm and height of 1.76 mm
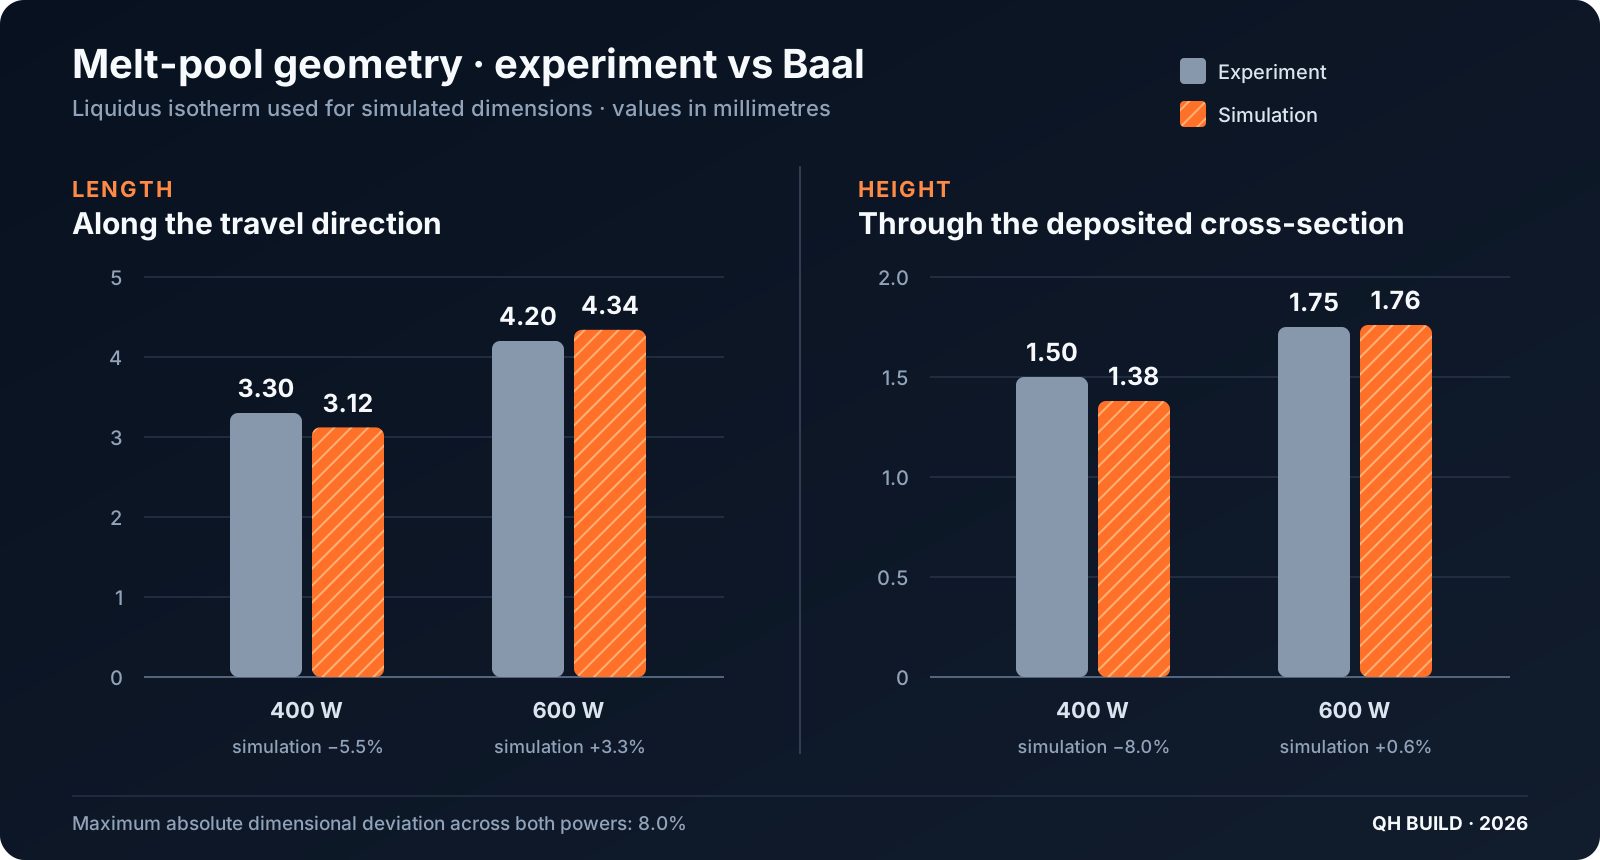 Original QH Build comparison of experimental and simulated melt-pool length and height at 400 W and 600 W
At 400 W, the measured and simulated melt-pool lengths are 3.30 mm and 3.12 mm. At 600 W, they are 4.20 mm and 4.34 mm. For melt-pool height, the corresponding comparisons are 1.50 mm versus 1.38 mm and 1.75 mm versus 1.76 mm.
Across the four dimensional comparisons, the maximum absolute deviation is 8.0%.
What was modeled
The simulation uses:
- a Goldak volumetric heat-source model;
- an initial temperature of 300 K;
- temperature-dependent convection on the deposited wall;
- a constant substrate convection value of 5 W·m⁻²·K⁻¹;
- surface radiation with an emissivity of 0.6;
- solidification latent-heat release;
- a refined 0.25 mm mesh in the build region; and
- a 0.025 s time step.
Temperature-dependent Ti-6Al-4V thermophysical properties were taken from the recommended-property compilation by K. C. Mills.
Calibration disclosure
The only fitted boundary parameter was convection. It was not fitted separately for Ti-6Al-4V and SS316L, and the curves displayed in this article were not used for fitting. They are independent validation results.
This distinction matters. Calibration asks whether a model can be adjusted to represent known data. Validation asks whether the resulting model can predict evidence that was kept outside that adjustment.
What this result supports
This case supports the use of Baal Hammon Thermomechanics for predicting layer-by-layer thermal histories and melt-pool dimensions across the tested Ti-6Al-4V conditions. It does not imply universal accuracy for every machine, beam profile, geometry or boundary condition. New systems still require clearly defined inputs and targeted physical validation.
That is the standard QH Build is working toward: show the evidence, disclose the assumptions and keep the claim inside the validated envelope.
Technical basis
- Patrice Peyre, Morgan Dal, Sébastien Pouzet and Olivier Castelnau, Simplified numerical model for the laser metal deposition additive manufacturing process, Journal of Laser Applications 29, 022304 (2017). DOI: 10.2351/1.4983251.
- Vaibhav Nain, Efficient thermomechanical modeling of large parts fabricated by Directed Energy Deposition Additive Manufacturing processes, doctoral thesis (2022).
- K. C. Mills, Ti-6Al-4V (IMI 318), in Recommended Values of Thermophysical Properties for Selected Commercial Alloys (2002). DOI: 10.1533/9781845690144.211.
- Experimental geometry was redrawn by QH Build. Simulation imagery and comparison graphics are QH Build outputs.