From Test Lines to Process Limits: Validating Baal Hammon Multiphysics
Thirty continuous 316L test lines probe power and standoff distance while five robot speeds challenge each line—testing whether Baal Hammon predicts both bead geometry and the onset of breakup.
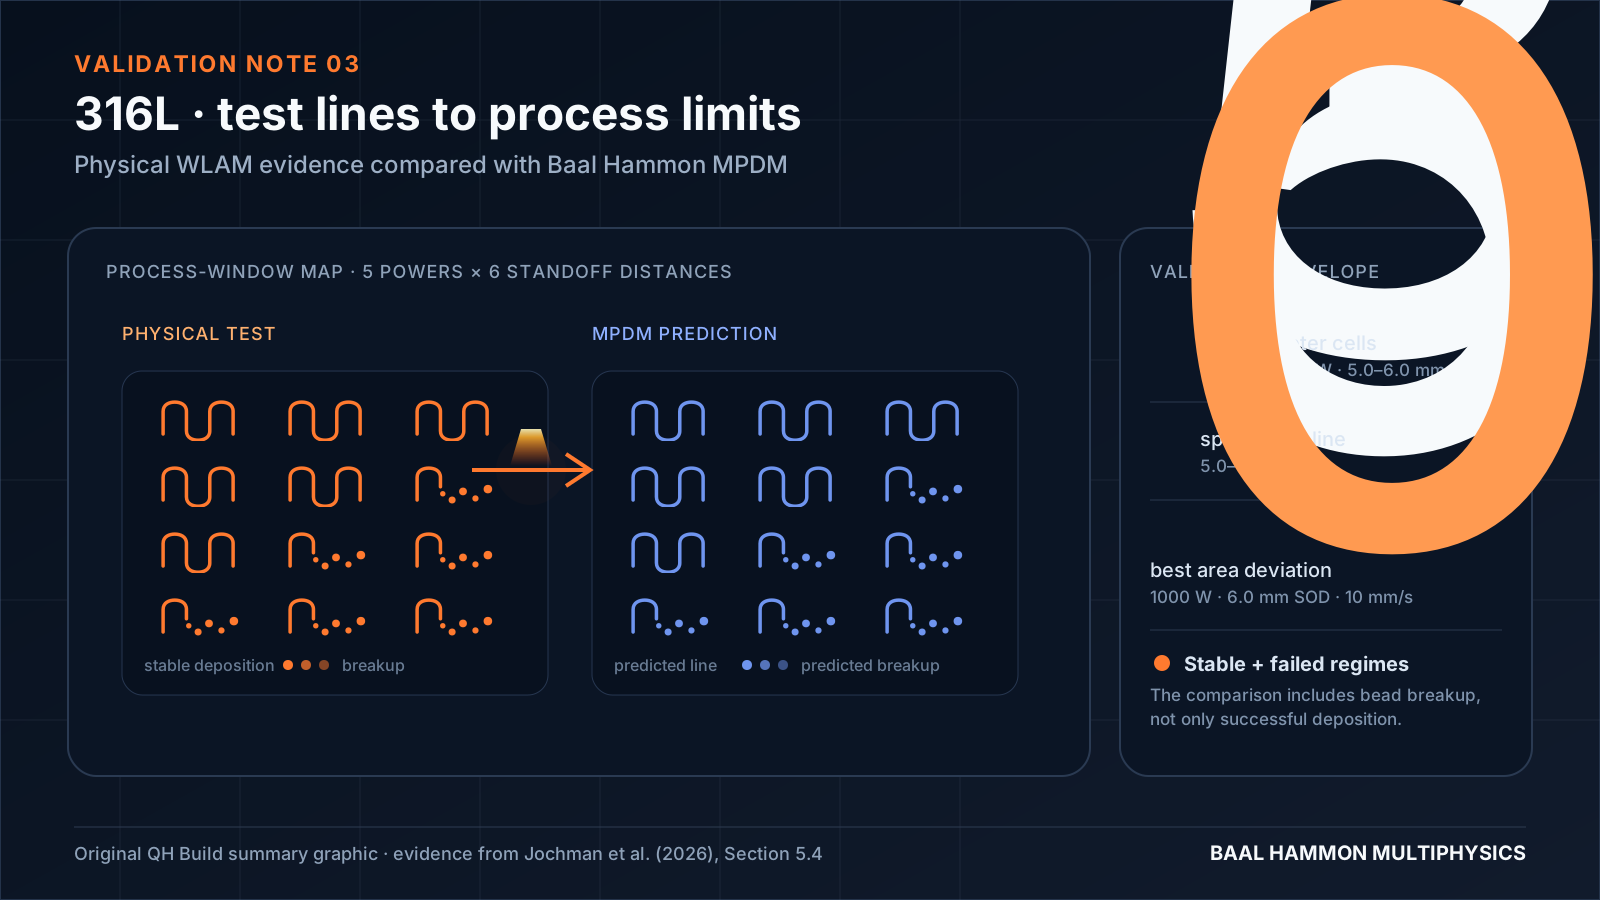
A useful process model should do more than reproduce a bead after the process has already succeeded. It should also identify where stable deposition ends—and fail in the same way the machine fails.
That is the purpose of this testing-line study. A physical 316L wire-laser additive manufacturing matrix was built across changing laser power, robot speed and standoff distance. The same matrix was then simulated with the Multiphysics Deposition Model, or MPDM, in Baal Hammon Multiphysics.
The comparison asks three progressively harder questions:
- Does the model locate the same stable and unstable regions as the experiment?
- Within the viable region, does it reproduce the deposited cross-sectional area and bead shape?
- At a failing condition, does it reproduce the observed transition from a continuous line to separate molten-metal blobs?
A process window built into the test plate
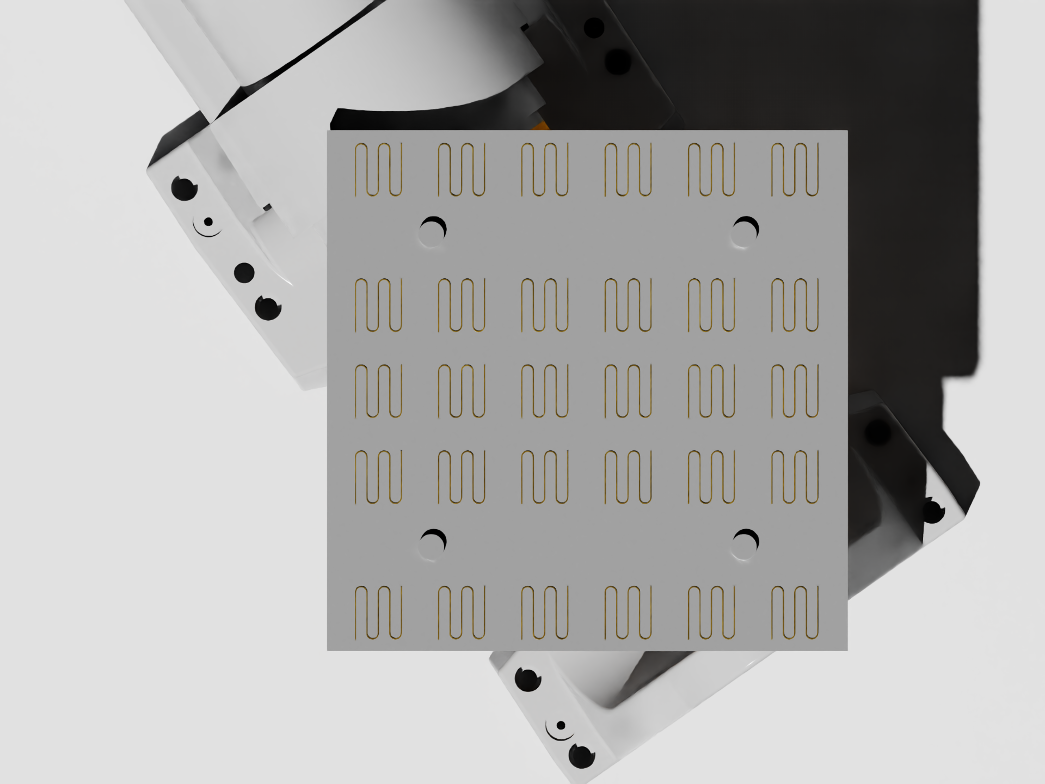 Physical WLAM test matrix with 30 meander-shaped SS316L samples arranged across five laser powers and six standoff distances
The plate contains 30 continuous meander samples. Each sample covers approximately 50 × 45 mm and combines straight and curved motion without interrupting deposition.
The matrix varies:
- laser power from 600 to 1000 W in 100 W steps;
- standoff distance from 5.0 to 6.0 mm in 0.2 mm steps; and
- robot speed from 5.0 to 15.0 mm/s in 2.5 mm/s steps within each meander.
Wire feed remains fixed at 15.28 mm/s, wire preheating at 2 A and shielding-gas flow at 10 L/min. This creates a deliberately coupled test: power and nozzle position change from sample to sample, while speed changes segment by segment inside each continuous line.
The printed samples were digitized with a Leica AT960 laser tracker and Absolute Scanner AS1. The resulting geometry provides the experimental reference for the simulated deposition map and bead cross-sections.
What Baal Hammon represents
The physical Meltio V2 head uses six lasers, each capable of 200 W, converging around the wire. For computational efficiency, MPDM represents their combined heat input as an equivalent ring-shaped laser source.
The model couples the mechanisms that determine whether a line remains continuous: laser–metal energy absorption, temperature-dependent viscosity and surface tension, material feed dynamics, heat transfer into the substrate, melt-pool flow and solidification.
This matters because the validation target is not temperature alone. It is the deposited material itself: where the line forms, how its cross-section changes with speed and where it breaks apart.
First test: the process-window map
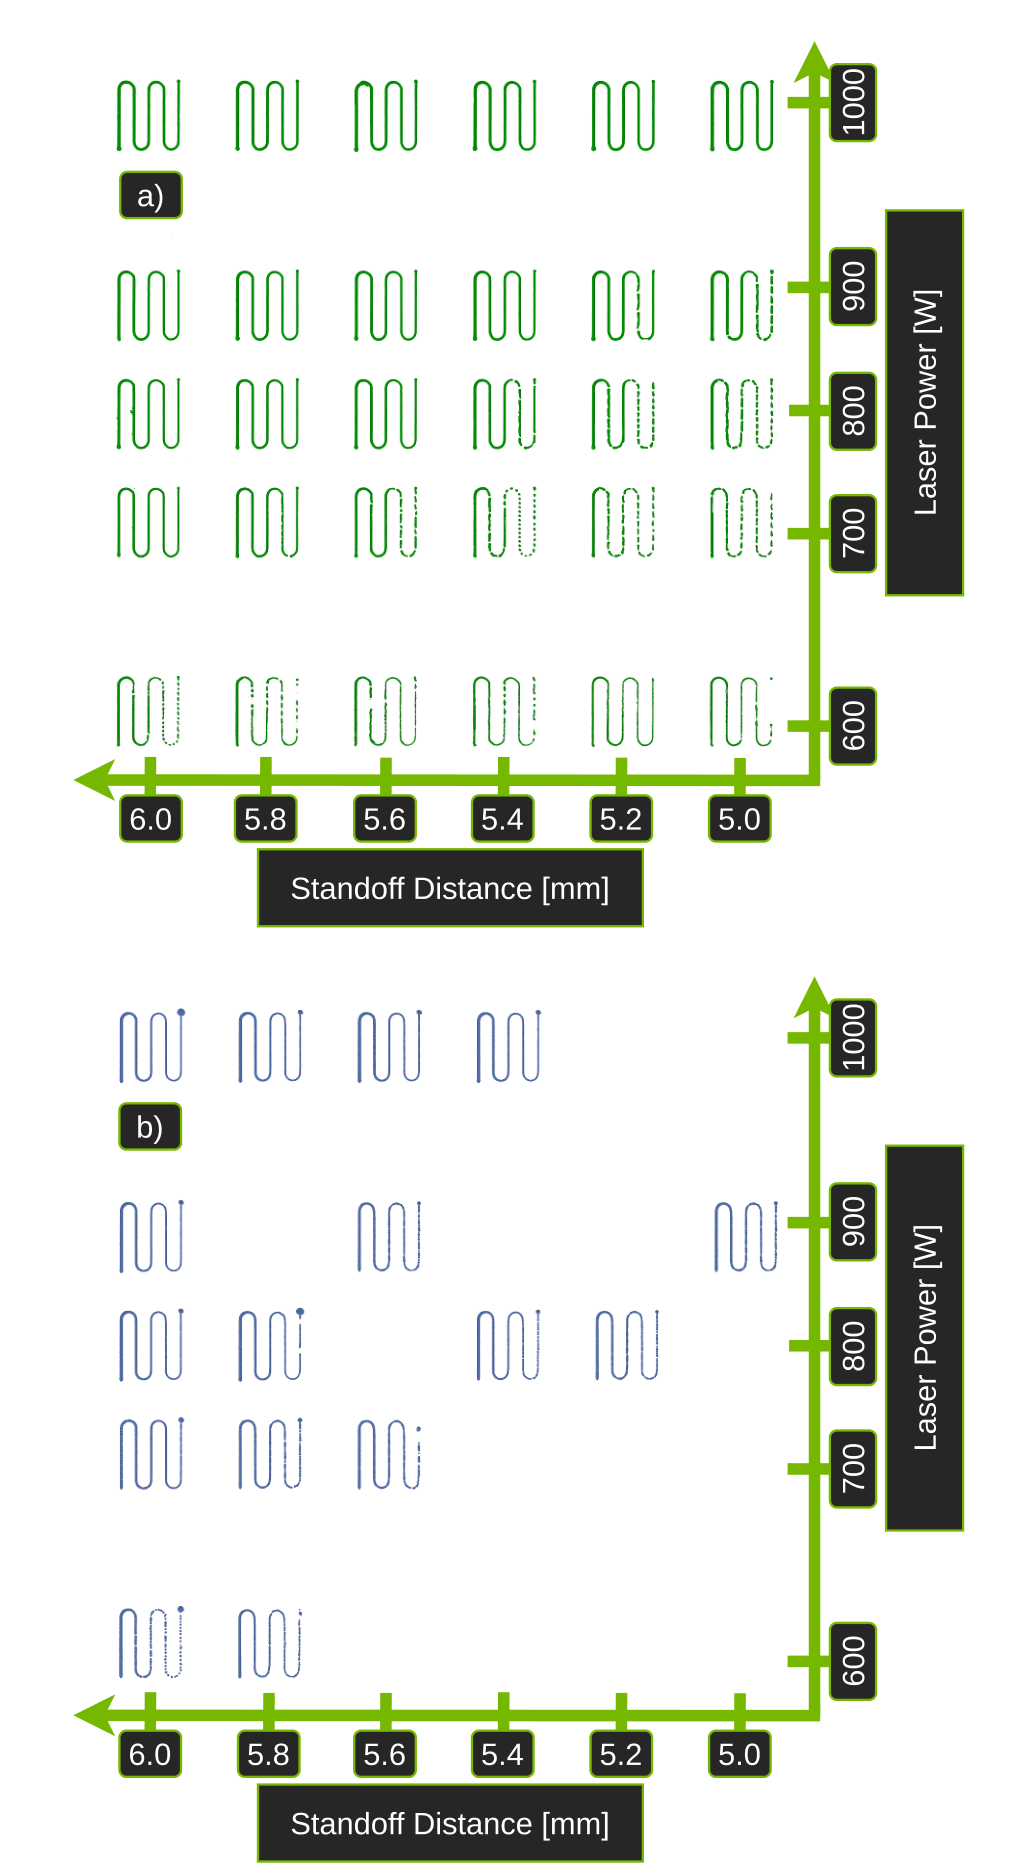 Experimental deposition map in green above the Baal Hammon MPDM prediction in blue across laser power and standoff distance
The upper map is reconstructed from the physical scans; the lower map is the MPDM prediction. Each location represents one power–standoff combination, and the five sections inside each meander correspond to increasing robot speed.
The comparison captures the central process trend: higher speed at constant wire feed reduces deposited width and height, while low energy input and unfavorable standoff conditions push the process from a continuous bead toward discontinuous deposition.
Just as importantly, the simulation does not fill every cell with a plausible-looking line. It leaves gaps and predicts breakup in the same regions where the physical process could not sustain stable deposition.
Second test: geometry inside the viable region
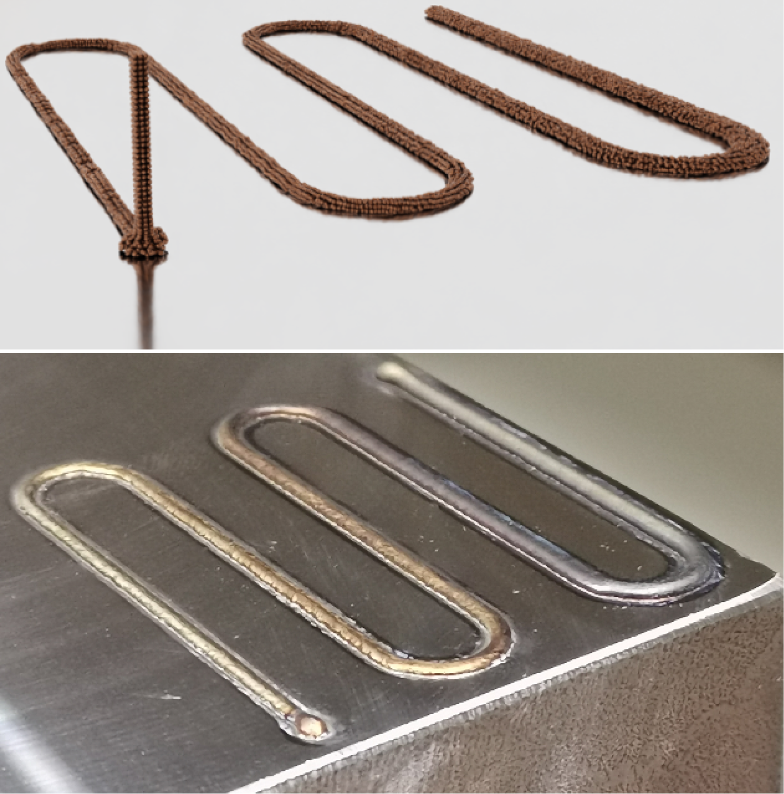 Baal Hammon particle-based prediction above the scanned physical bead for the representative 1000 W and 6.0 mm standoff line
The 1000 W, 6.0 mm standoff line provides a representative quantitative comparison. Both the simulated and physical results show the bead becoming smaller as robot speed increases.
Across 5.0, 7.5, 10.0, 12.5 and 15.0 mm/s, the absolute deviations in cross-sectional area are 8.35%, 5.72%, 0.45%, 2.73% and 16.10%, respectively. The underlying values are reported as mean ± standard deviation for three cross-sections at each speed.
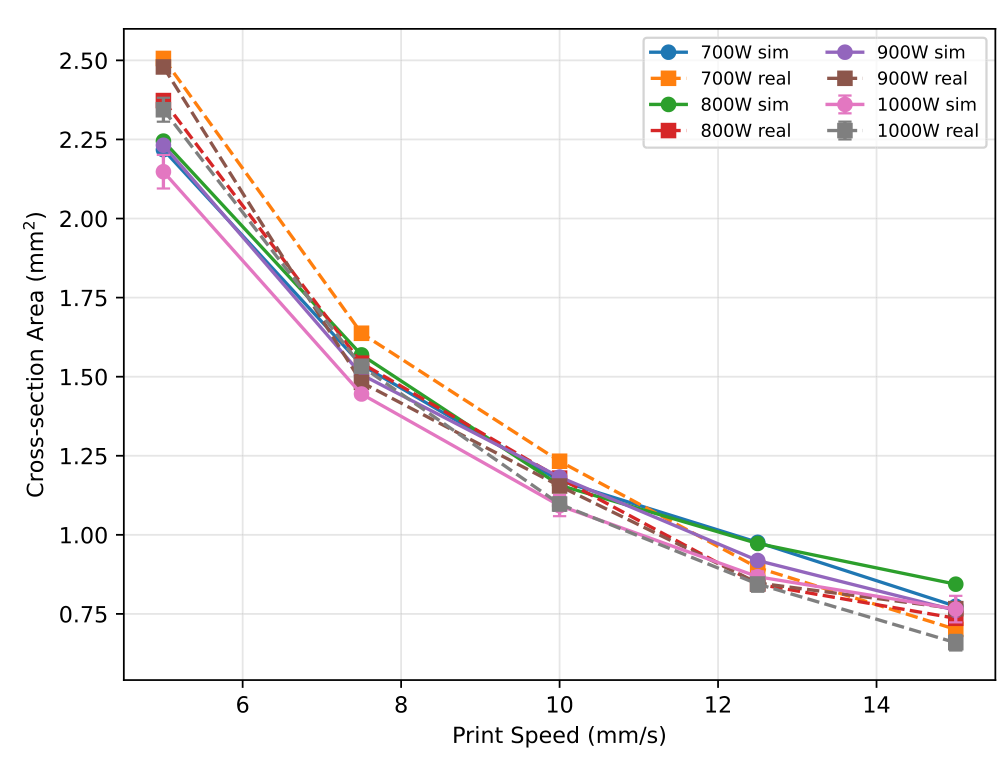 Simulated and experimental SS316L cross-sectional area versus print speed at 6.0 mm standoff distance for 700 to 1000 W
The closest area match occurs at 10 mm/s, where the simulation predicts 1.0924 mm² and the scan reports 1.0974 mm²: an absolute deviation of 0.45%.
The study also compares a cap fill factor—a compact measure of how the real bead profile differs from an ideal semi-elliptical cap. Its absolute deviations across the same five speeds are 1.47%, 3.40%, 8.51%, 3.86% and 11.74%.
The full series is more informative than its best point. Agreement is strongest in the central operating region and worsens as the process approaches a stability limit at 15 mm/s. The 600 W series is not included in the geometry plot because deposition was predominantly unstable and no consistent bead cross-section could be measured.
Third test: predict the failure mode
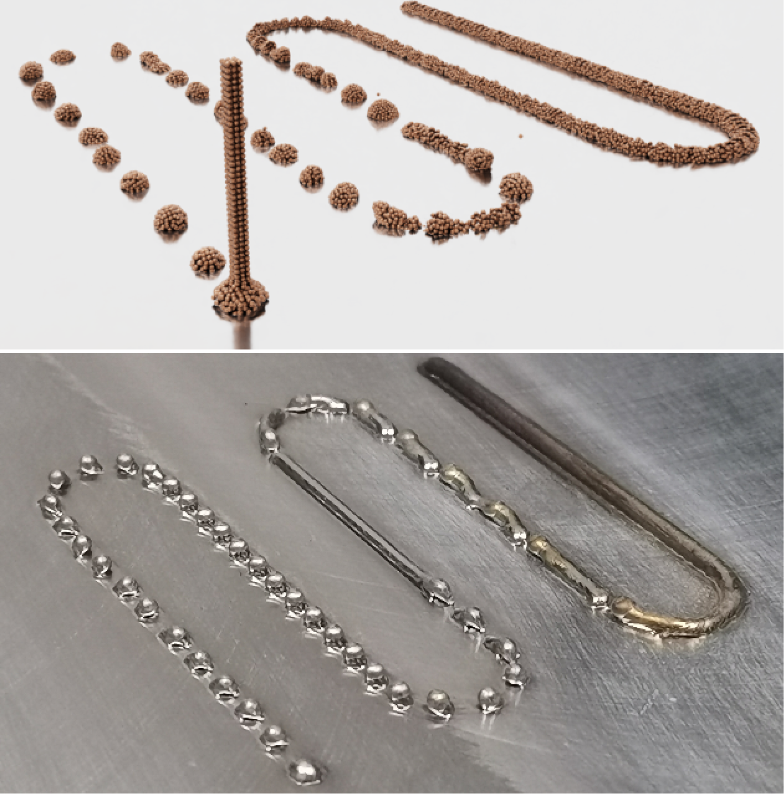 Baal Hammon prediction above the physical test at 700 W and 5.4 mm standoff distance, both showing a continuous line giving way to separated metal blobs
At 700 W and 5.4 mm standoff distance, increasing speed moves the process beyond the effective melting range. The wire is no longer fully incorporated into a continuous bead, and separate molten-metal blobs form instead.
MPDM reproduces this transition spatially. The particle-based result does not merely label the condition “unstable”; it predicts the breakup of the deposited stream and the progression toward discontinuous material, matching the defect morphology visible on the physical plate.
This is the most consequential part of the validation. A digital twin intended for process planning must distinguish a slightly different bead from a condition that cannot produce a viable line at all.
Computational note
Each testing-line simulation required approximately 20 minutes with the study's fully implicit SPH formulation. Solving the pressure Poisson equation implicitly allowed stable time increments of up to 18 ms without a conventional CFL time-step restriction.
The speed matters because a process-window tool is useful only if engineers can evaluate alternatives before the cost of physical iteration overtakes the value of the prediction.
What this study validates—and what it does not
The evidence supports Baal Hammon MPDM for predicting deposited geometry, speed-dependent bead response and stable-versus-breakup behavior inside this SS316L WLAM test envelope.
It does not establish universal accuracy for other alloys, optics, wire diameters, robots or boundary conditions. Surface scans also do not validate internal porosity, chemistry, mechanical properties or every possible defect mechanism. Those outcomes require their own measurements and validation cases.
Within those boundaries, the result demonstrates the value of a physics-led process window: not a single tuned image, but a structured comparison across 30 power–standoff combinations, five speeds per line and both successful and failed deposition regimes.
Technical basis
- Tomas Jochman, Abdi Mehdi, Vaclav Voltr, Ondrej Svec, Pavel Burget and Vaclav Hlavac, Digital twin–ready acceleration of production–scale wire laser additive manufacturing using NVIDIA Omniverse, Results in Engineering 30 (2026) 111005. Section 5.4. DOI: 10.1016/j.rineng.2026.111005.
- Experimental and simulation figures are reproduced from the authors' Section 5.4 validation study. The featured summary graphic is an original QH Build visualization based on the reported test matrix and results.